Cases · Sales report
A quarter of a Shopify shop, analysed and checked
Self-initiated case study using synthetic data in the real Shopify export format.
The case
Goal
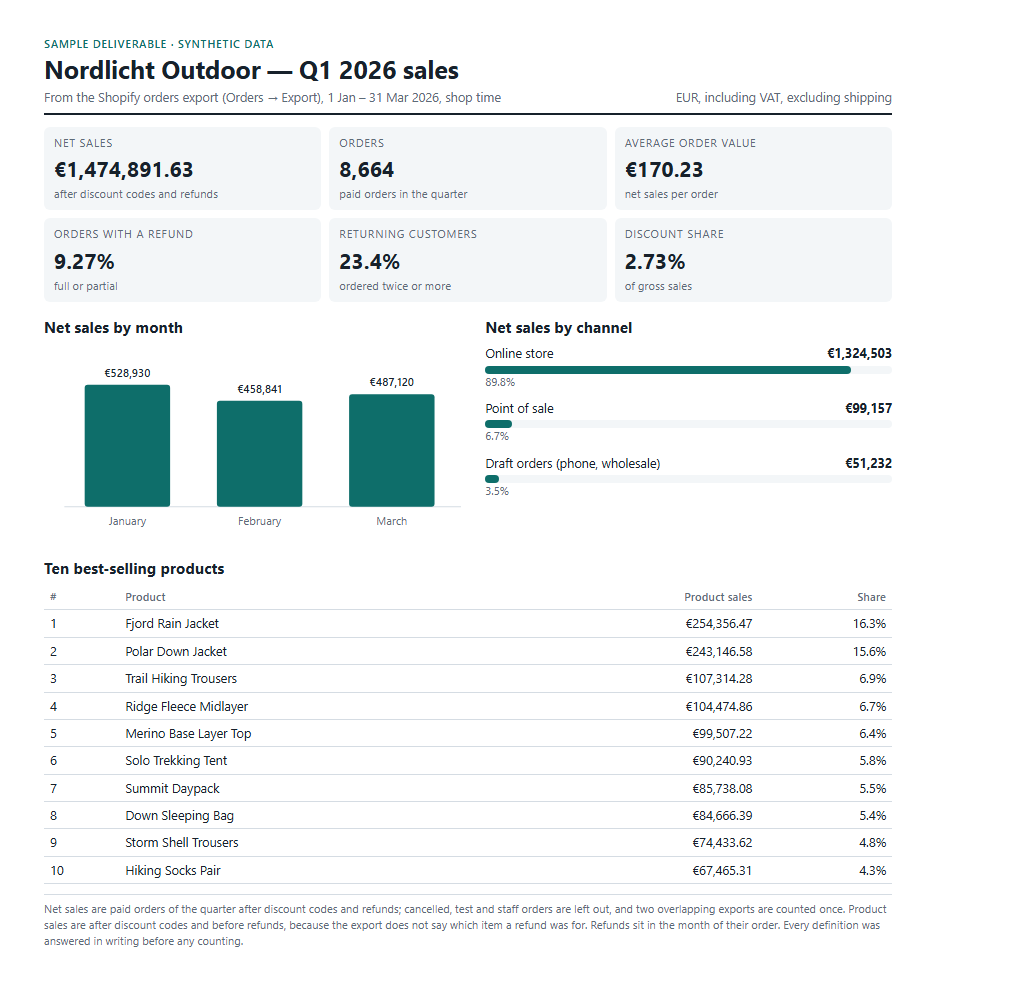
A shop owner wanted a sales report for Q1 from the Shopify orders export: net sales by month, orders, average order value, refunds, discounts, top products, repeat customers, channels.
Challenge
21,687 rows, one per line item. Two overlapping downloads put 1,068 orders in twice; cancelled, test and staff orders; VAT-inclusive prices and discount codes. Some questions, such as whether a partial refund includes shipping, the data cannot answer.
Solution
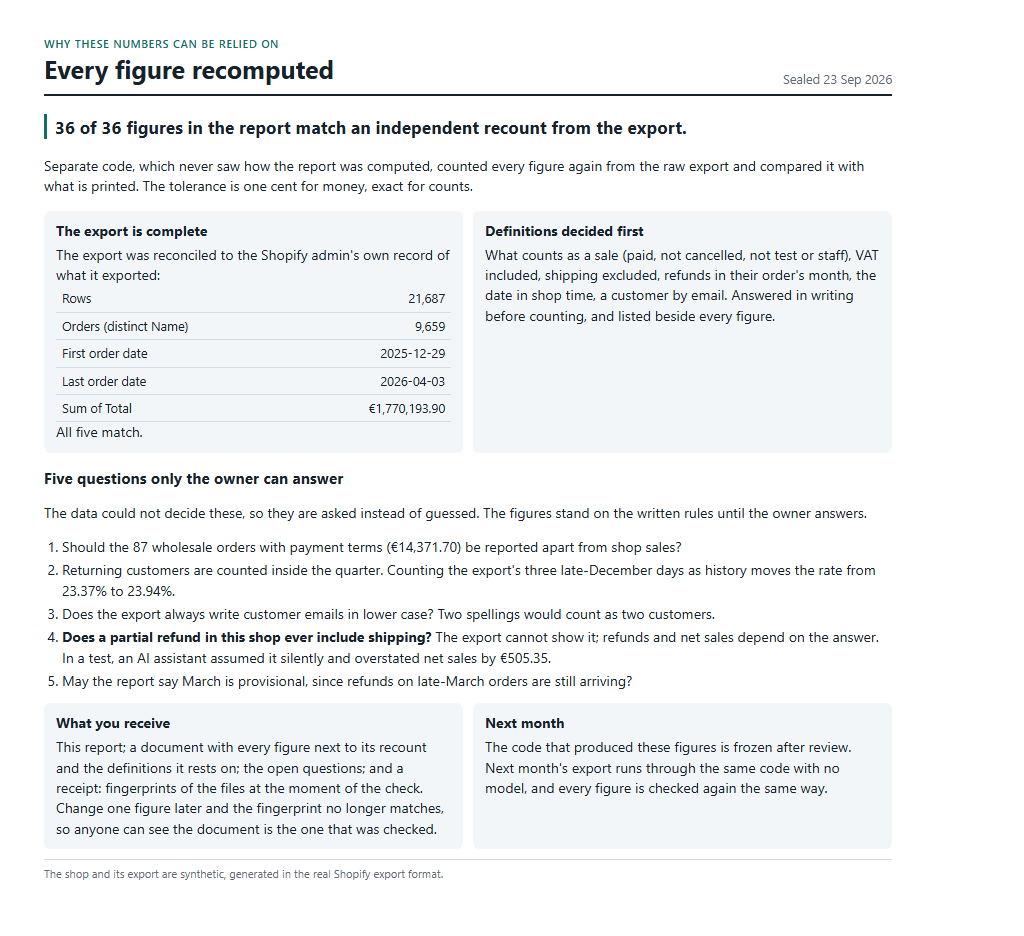
38 definitions answered in writing before counting; in this demonstration an AI model answered them under the owner's delegation, and the document says so beside every rule. 21,687 rows became 9,659 orders, 8,664 sales and 36 figures. 926 checks, 678 by code and 248 by reviewers, held the work to the export, and separate code recounted every figure. The export's totals matched a control file; here the data generator writes it, and for a real shop the totals come from another source, such as the payouts.
Outcome
Net sales EUR 1,474,891.63 from 8,664 sales, 36 of 36 figures matched, and five questions only the owner can answer, asked instead of guessed. For another month, the checks built for this month are first rewritten to work for any month and reviewed once; then each month is checked the same way.
From the case
The sample report, 2 pages (PDF)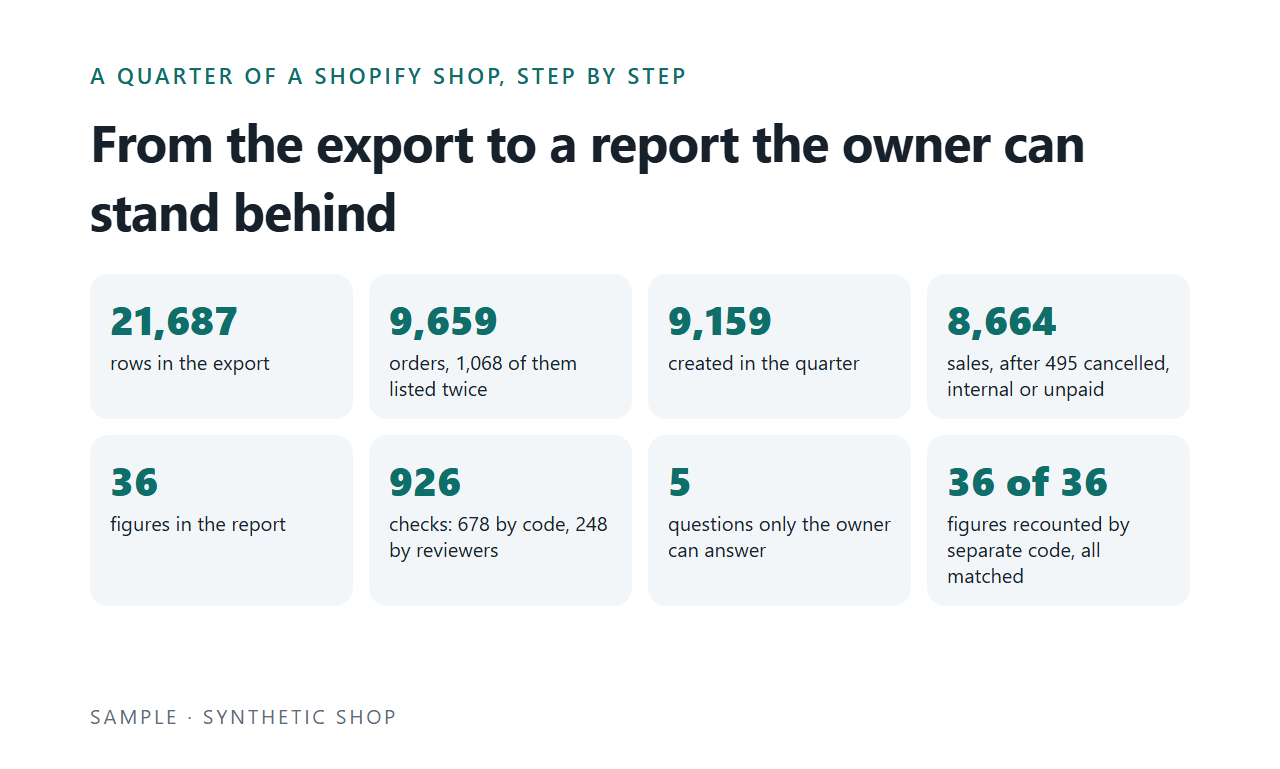
Service
Sales reports for your own files
The same method on your exports: definitions in writing first, then an independent recount.